A Process Map is a technical document which displays technical information in the Node, the top and bottom sections of the Process Map, find out more about the node. The style and information displayed can be updated from the Node Editor page.
As standard, only Admins can customise the node.
To update your node style go to the Node Editor page:
- Click on the Node Editor menu option in the Library Appearance section of the menu on the left hand side of your screen.
- Click on the edit button next to the node you would like to update in the node list.

- This will take you to the Node Editor page, from here you can:

After you have made your changes to the node editor you must click Save Changes at the bottom of the page to instantly update all the process maps in your library.
Change the node style
- Node margins (distance from the side of the page in cm) can be updated in the Margins section. To update the margins either use the arrows to increase or decrease the margins or type the value directly into the box.
Changing the left and right margins affects both the top and bottom nodes, but changing the top and bottom margins only affects the top or bottom node.

- To change the node height use the arrows to increase or decrease the height or type the value directly into the height box.
- To change the proportion split of the top and bottom nodes and enable you to give more space to one section and less space to another section drag the circle along the Top Bar or Bottom Bar section until the proportions are set up as required.

- To update the node styling by changing the background colour, text colour or border colour click on the dropdown and choose a colour from the colour picker or type in the RGB or HEX vales.

- Once you have updated your colour click OK to confirm or Cancel to reset your changes.
- After you have made your changes to the node styling click Save Changes to instantly update all the Process Maps in your library.
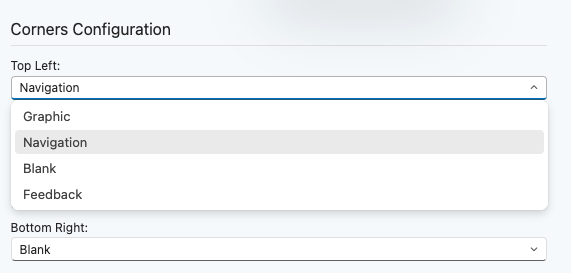
Update the corner data
- Data can be displayed in all four corners of the Process Map, or they can be left blank. Each corner can display the following options:
- Navigation - display an arrow to navigate between Process Maps which have drill downs in place
- Graphic - display a graphic of your choice
- Blank - leaves the corner blank
- Feedback - link to a Feedback URL of your choice, for example an email address or a Crowd in ATC
If you do not update your Feedback URL the Feedback link will direct users to the Triaster Process Library Feedback Crowd in ATC.
- To update the information displayed in each corner click on the dropdown for the corner you would like to edit.

- Select the dropdown option you would like to display in each corner.
- To update your Feedback URL type the URL into the Feedback URL box.
If you wish to link to an email address simply put 'mailto:' in front of the relevant email address. When it is clicked on your default email app will open with a new email pre-populated with this email address.
 To upload a graphic click on the Upload New button and select a graphic from your files.
 - You can remove the graphic with the Remove Graphic button.

- After you have made your changes to the corner data click Save Changes to instantly update all the Process Maps in your library.
Add properties to node fields
- You can add up to three properties each to the Top Field Part 3, Bottom Field Part 2 and Bottom Field Part 3. They will be displayed one on top of each other in the order they are displayed in the node editor section.
- By default the property selector is set to Built-in Properties which means you can only select a property from the Built-in Properties dropdown. This can be updated by clicking Swap next to each property line, allowing you to select a property from the Custom Properties dropdown.

- To select a property to display click on the relevant dropdown and select the property you wish to display on your map.

- If you wish the property to be displayed under a different label to the property title type your custom label into the Label Override box.

- Continue to add properties to each field until you have added as much information as you wish to the Process Map, once you have finished click Save Changes to instantly update all the Process Maps in your library.
Add a Watermark
- Add a Watermark to the maps in your Process Library in the Watermark section of the node editor.
- Click Upload New to select the Watermark from your files.

Ensure the watermark is the correct ratio (1:1.414) so it is displayed properly.
- You will see a preview of the Watermark you have uploaded.

- You can remove the Watermark with the Remove Watermark button.
- Click Save Changes to instantly display the Watermark on all the process maps in the Process Library.
The Watermark will not be visible on process maps on the edit screen.
Add a Primary and Secondary Strapline
- Add a Primary Strapline to the maps in your Process Library in the Strapline section of the node editor, simply type your desired Strapline into the text box. This will be displayed above the bottom node bar on all maps.

If you do not wish to have a primary strapline leave this section blank.
- Add a Secondary Strapline to your Process Library Maps in the Secondary Strapline section of the node editor by typing your strapline into the text box. This will be displayed below the bottom node bar on all maps.

If you do not wish to have a secondary strapline leave this section blank.
- Click Save Changes to instantly display the Primary and Secondary Strapline on all the process maps in the Process Library.